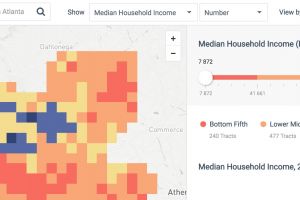
This project visualizes health data within the Atlanta metro region. Although some research about health inequities among this region has occurred, it typically is based on county-level data. In order to have a better understanding of health inequities and disparities in our home area, a city profile for Atlanta should be established. This project has created an interactive visualization of data such as rates of teen pregnancies, low birthweight babies, etc. The system allows the viewer to explore correlations among the different variables.

At the Information Interfaces Lab, computing technologies are developed that help people take advantage of information to enrich their lives. The lab group develops ways to help people understand information via user interface design, information visualization, peripheral awareness techniques and embodied agents. The goal is to help people make better judgments by learning from all the information available to them.


