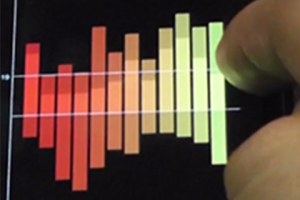
Visualization has an important role in science and technology. People rely on visualizations to better understand problems they have to solve. Information visualization has recently increased its domain, from being used for representations of business data, to more political and social uses via groups like visualizing.org and infosthetics.com. In parallel with this growth, we have seen the widespread acceptance of mobile technology by masses. Mobile phones, today, are being used for everything from email to ticketing and web browsing to watching videos. As society becomes more mobile, it is important to consider the application of information visualization on mobile and other touch-based devices. The aim of this project is to understand if and how traditional information visualization techniques like line charts, bar graphs, and treemaps can be useful in a mobile environment and what the best style of interaction with those charts should be.

At the Information Interfaces Lab, computing technologies are developed that help people take advantage of information to enrich their lives. The lab group develops ways to help people understand information via user interface design, information visualization, peripheral awareness techniques and embodied agents. The goal is to help people make better judgments by learning from all the information available to them.


