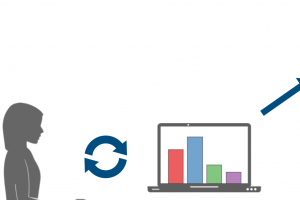
People increasingly rely on visual representations of information to explore and make sense of their data. However, people have inherent biases that often lead to errors and inefficiencies in the decision making process. The goal of our research is to help people make better decisions while exploring and analyzing data using visualizations. We introduce computational methods for quantifying an analyst's biases based on their interaction sequences in the visualization. Using that information, we illustrate ways to modify or design new visualization systems that mitigate biased decision making.


