
IEEE VIS 2018
Georgia Tech visualization research shapes data literacy and usability
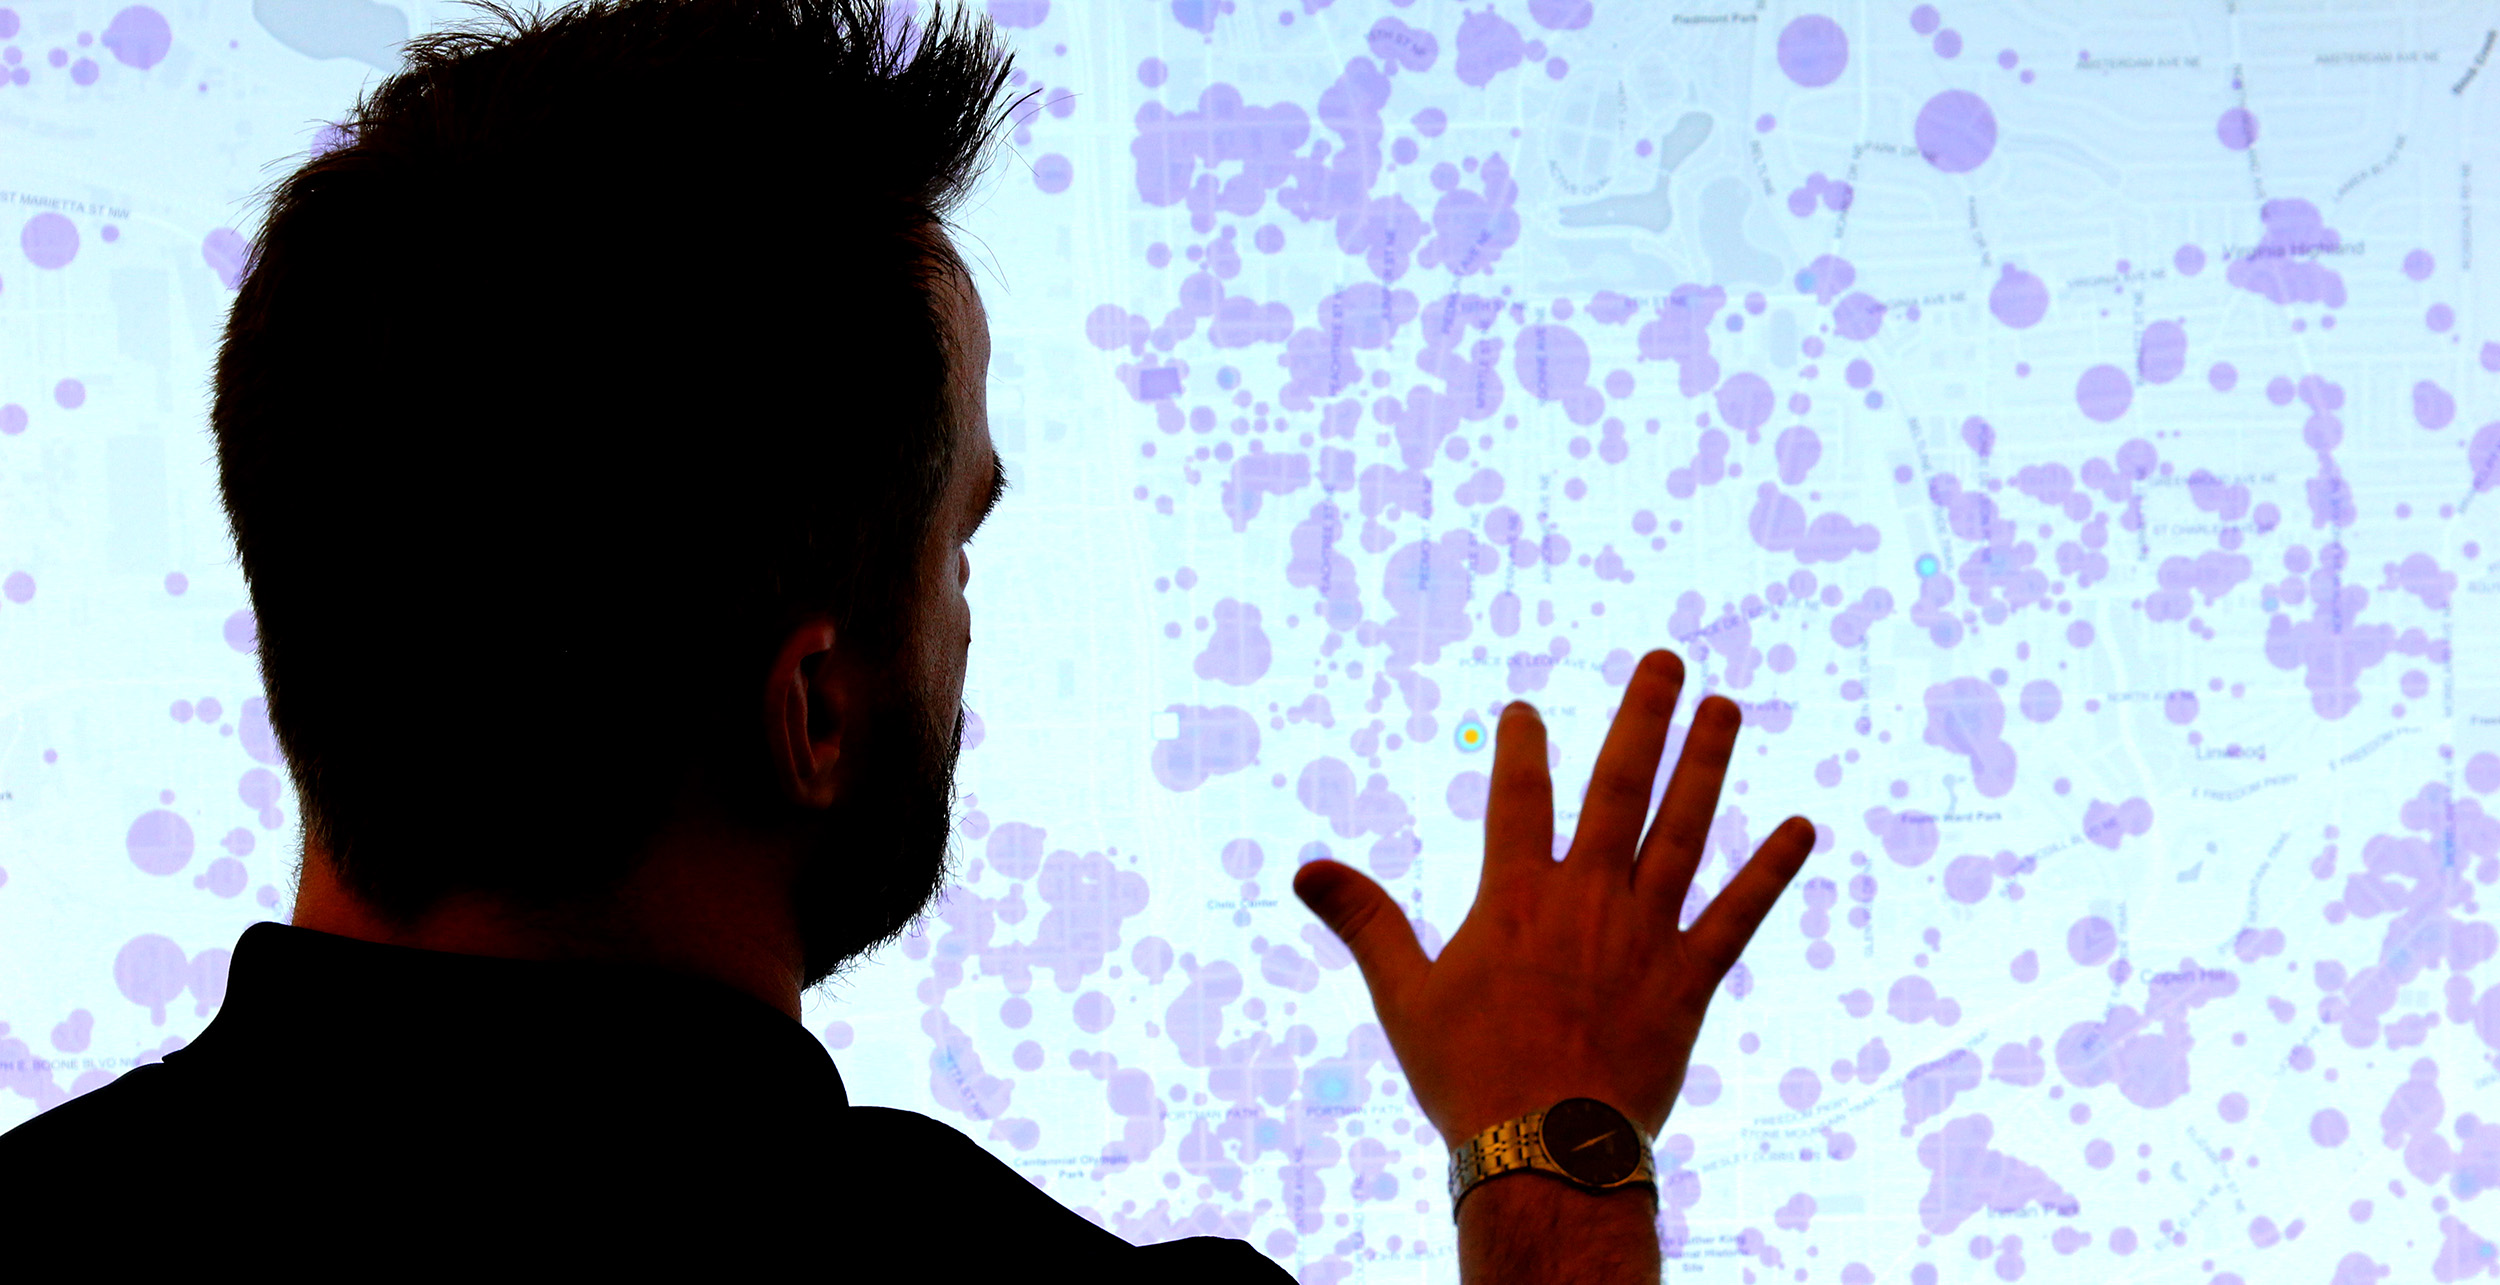
Digital data is a growing type of currency, offering insights for transforming businesses and organizations, allowing better decision making, and answering questions people didn’t even know they had. Data transactions are as common as convenience store purchases, yet the costs of those transactions are very different.
Information visualization researchers at Georgia Tech are developing ways people can better understand the world’s data and how to interpret its meaning through techniques that can surface key insights and make the data meaningful to users.
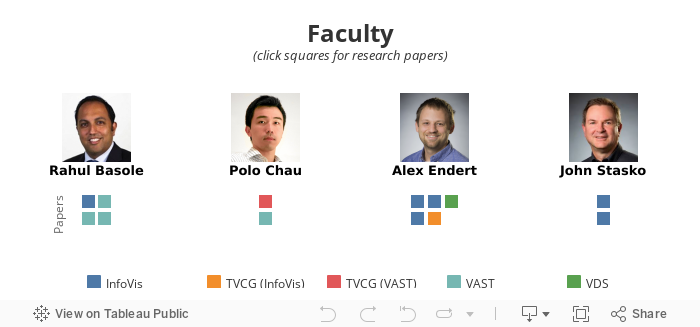
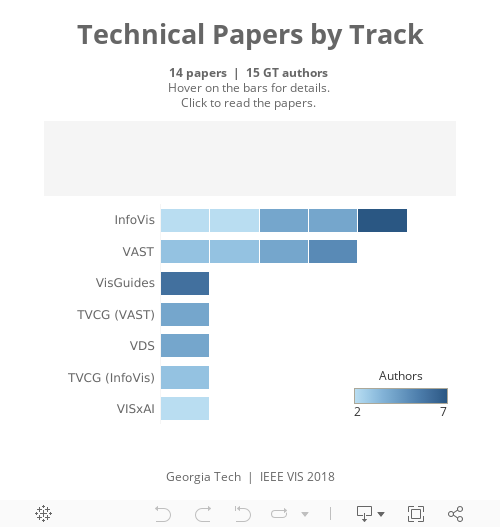
Georgia Tech faculty and graduate students will present their latest research in information visualization and visual analytics, including 14 papers, at the annual IEEE Visualization (IEEE VIS) Conference in Berlin, Germany, Oct. 21-26.
Of the 15 researchers, 11 are from the School of Interactive Computing and four represent the School of Computational Science and Engineering in the College of Computing. The faculty authors – Rahul Basole, Polo Chau, Alex Endert, and John Stasko – are members of the VIS Lab and GVU Center.
School of Interactive Computing Professor John Stasko, along with collaborators from Microsoft Research, will receive a Test of Time award for their 2007 paper Effectiveness of Animation in Trend Visualization. It is Stasko’s second straight year receiving such a designation at IEEE VIS. Read about last year's award.
IEEE VIS is the largest conference on scientific visualization, information visualization, and visual analytics.
RESEARCH HIGHLIGHTS
Developing a consistent rating method for visualization design
 Presenting data visually is as simple as making a bar chart, but evaluating effective visualizations is a more complex task that researchers are attempting to simplify. Ph.D. CS student Emily Wall and her co-authors have developed a method that allows evaluators with no knowledge of visualization design principles to assess the visualization and assign a rating from 1-7 for different aspects of the data viz (an overall score of 5 is a “pass”). The methodology, ICE-T, is fashioned to be a consistent rating technique, the first of its kind, allowing data designers to better evaluate their visualization’s effectiveness. Researchers found that the methodology produced consistent ratings across three sample visualizations. Users can test their own vizzes using ICE-T.
Paper: A Heuristic Approach to Value-Driven Evaluation of Visualizations
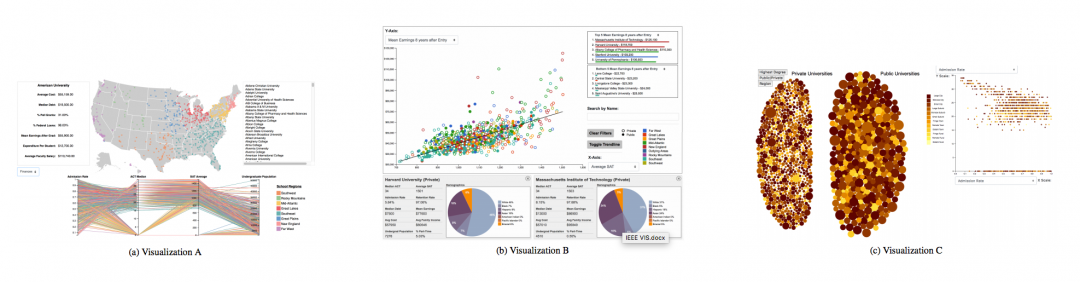
Three data vizzes of U.S. university data. The center viz had the highest score using a novel Georgia Tech method to evaluate effectiveness of the data presentation.
Customizing data interactivity and presentation to help users interpret visualizations
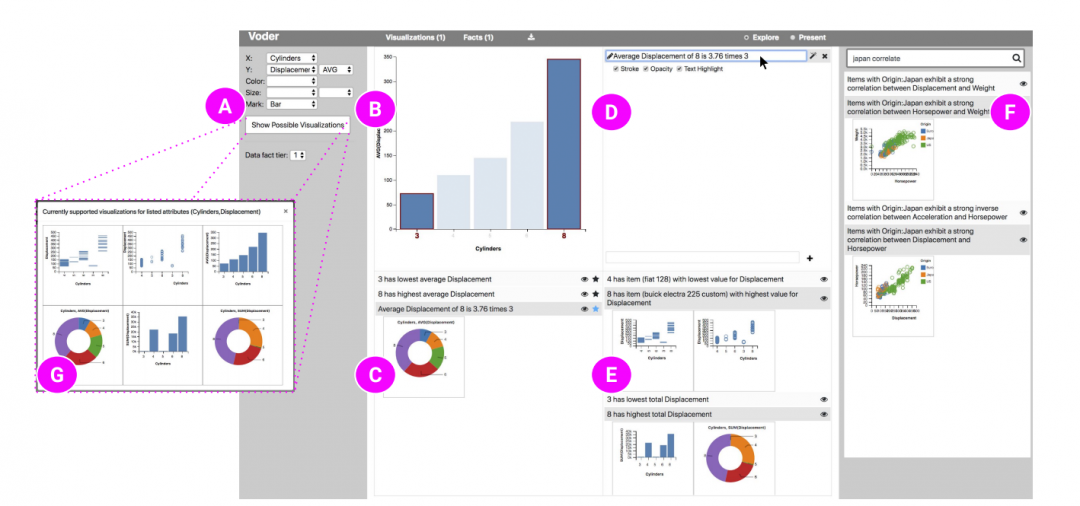
 Chart choices and interaction options can make or break a user's understanding of the data. Georgia Tech and Microsoft researchers are aiming to provide an option in interactive visualizations to pivot between those showing various aspects of the data – aggregated vs. data case-level values, for example. To that end, they present Voder, a system that lets users interact with automatically-generated data to explore alternative visualizations that convey data as well as a set of embellishments that highlight facts within the visualization. To assess the design, Ph.D. CS student Arjun Srinivasan and co-authors conducted a user study with 12 participants with preliminary results showing that interactive data facts aided in interpreting visualizations.
Paper: Augmenting Visualizations with Interactive Data Facts to Facilitate Interpretation and Communication
Picking the right chart for the right job
 Ph.D. CS student Bahador Saket and a team of GT researchers have found that people prefer specific visualization types - bars, line chart, etc. - based on the task at hand or the context of the data. The team trained a recommendation system to allow user data to be evaluated and visualized for optimal use. Their system is built to shift some of the visualization design and exploration decisions from users to algorithms. Based on ten common data tasks, the research shows best practices for data designers in considering time, accuracy and preference needs:
- Use bar charts for finding clusters.
- Use line charts for finding correlations.
- Use scatterplots for finding anomalies.
- Avoid line charts for tasks that require readers to precisely identify the value of a specific data point.
- Avoid using tables and pie charts for correlation tasks.
Paper: Task-Based Effectiveness of Basic Visualizations
Enabling non-experts to understand and experiment with neural networks
Georgia Tech and Google Brain researchers have developed an open-source interactive tool, GAN Lab, created for a wide audience – including non-experts – to learn, experiment, and play with GANs, or generative adversarial networks. GANs can be used to produce realistic images or simulations, create art, or enhance blurry photos. But they are subject to attack and can be compromised in systems that are dependent on image recognition, such as self-driving cars. Lead author and Ph.D. CS student Minsuk (Brian) Kahng says GAN Lab can be used to interactively train a GAN model by experimenting with several options, and the tool visualizes the model’s inner-workings, helping people understand the complex model training process.
Paper: GAN Lab: Understanding Complex Deep Generative Models using Interactive Visual Experimentation
Learn more about GT research in information visualization and visual analytics:
Georgia Tech Visualization Lab
Be a part of the conversation at IEEE VIS 2018:
@ieeevis | @gt_vis
Story: Joshua Preston, David Mitchell, and Kristen Perez | Interactive Graphics: Joshua Preston | Video: Terence Rushin
